

The neotoma package is a programmatic R interface to the Neotoma Paleoecological Database. The package is intended to both allow users to search for sites and to download data for use in analyical workflows of paleoecological research.
neotoma is part of the rOpenSci project and is also hosted on Figshare. The neotoma package is also available on CRAN as of May 3, 2015.
For more information on the package please refer to:
Goring, S., Dawson, A., Simpson, G. L., Ram, K., Graham, R. W., Grimm, E. C., & Williams, J. W.. (2015). neotoma: A Programmatic Interface to the Neotoma Paleoecological Database. Open Quaternary, 1(1), Art. 2. DOI: 10.5334/oq.ab
We welcome contributions from any individual, whether code, documentation, or issue tracking. All participants are expected to follow the code of conduct for this project.
Package functions resolve various Neotoma APIs and re-form the data returned by the Neotoma database into R data objects. The format of the Neotoma data, and the actual API functions can be accessed on the Neotoma API website.
If you have used the package please consider providing us feedback through a short survey.
neotomaneotomaMore functions are available through the package help. These represent the core functions:
get_site - obtain information on sites in the Neotoma dataset (which may contain multiple datasets). APIget_dataset - obtain dataset metadata from Neotoma. APIget_download - obtain full datasets (pollen or mammal) from Neotoma. APIcompile_list - using established pollen-related taxonomies from the literature, take the published taxon list and standardize it to allow cross site analysis.get_contact - find contact information for data contributors to Neotoma. APIget_publication - obtain publication information from Neotoma. APIget_table - return matrices corresponding to one of the Neotoma database tables. tablesget_taxa - Get taxon information from Neotoma. APIget_chroncontrol - Get chronological information used to build the age-depth model for the record. APIget_dataset(gpid=123) was returning an error, fix corrects the error to allow unassigned x variables. Updated the allowable dataset types for searching to reflect the larger set of dataset types within Neotoma.get_site() and get_dataset() functions so that a vector of dataset or siteids can be passed to improve more general workflow methods.taxa() function to easily extract taxa from one or multiple download objects.compile_download(), single sample downloads were failing to compile properly, added the taxa() function to extract taxa lists from large download objects.plot_leaflet() to allow interactive exploration of downloaded Neotoma data. Integrates with the Neotoma Explorer. Minor bugfix for get_download() to allow records to be sent to Neotoma and to be filtered.plot() method based on tests against Tilia files in the Neotoma Holding Tank & built more robust interpolation in read_bacon() so that age models without interpolated dates can still be imported. browse() now opens multiple datastes in the Neotoma Explorer at once.Stratiplot() method, using the analogue package to plot dataset diagrams from download and download_list objects, bug fixes for write_agefile() and a new function, read_bacon(), to read in and integrate Bacon chronologies into download objects.gpid selection. Added a get_closest() function to find the closest sample site. Mostly clean-up of reported bugs by users. Revised examples for faster check speed.get_dataset() for site level data to account for some datasets with empty submission data. Some style changes to code (non-functional changes)read.tilia() added to read Tilia (http://tiliait.com) style XML files. Moved to using xml2, httr and jsonlite to support parsing.get_geochron() to address bug reports and improve object print methods.plot() method for datasets, sites & downloads. Fixed a bug with records missing chronologies.# Example requires the mapdata package:
library('mapdata')
# You may use either '%' or '*' as wildcards for search terms:
test <- get_dataset(taxonname='Mammuthus*')
The API call was successful, you have returned 3273 records.
site.locs <- get_site(test)
# A crude way of making the oceans blue.
plot(1, type = 'n',
xlim=range(site.locs$long)+c(-10, 10),
ylim=range(site.locs$lat)+c(-10, 10),
xlab='Longitude', ylab = 'Latitude')
rect(par("usr")[1],par("usr")[3],par("usr")[2],par("usr")[4],col = "lightblue")
map('world',
interior=TRUE,
fill=TRUE,
col='gray',
xlim=range(site.locs$long)+c(-10, 10),
ylim=range(site.locs$lat)+c(-10, 10),
add=TRUE)
points(site.locs$long, site.locs$lat, pch=19, cex=0.5, col='red')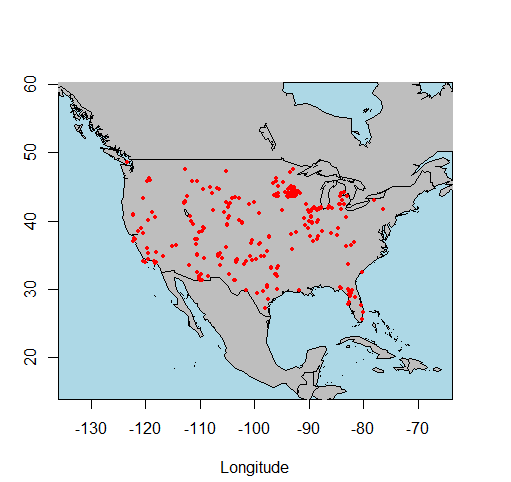
# Requires ggplot2
library('ggplot2')
library('plyr')
pubs <- get_publication()

pub.years <- ldply(pubs, "[[", "meta")

ggplot(data=pub.years, aes(x = year)) +
     stat_bin(aes(y=..density..*100, position='dodge'), binwidth=1) +
     theme_bw() +
     ylab('Percent of Publications') +
     xlab('Year of Publication') +
     scale_y_continuous(expand = c(0, 0.1)) +
     scale_x_continuous(breaks = seq(min(pub.years$year, na.rm=TRUE), 2014, by=20))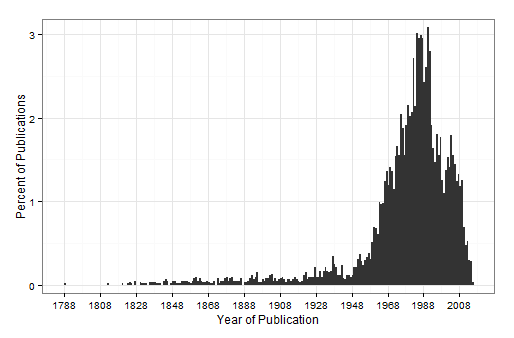
Found at this gist

Found at this gist. Prepared in part for a Bacon (Blaauw & Christen, 2011) workshop at the 2015 International Limnogeology Conference in Reno-Tahoe, Nevada led by Amy Myrbo (University of Minnesota).
Simple paleo-data visualization in R, linking the rioja, neotoma and dplyr packages. Found at this gist.
Found at Simon Goring’s gist..
taxize:Found at Simon Goring’s gist..
neotomaneotoma WorkshopsWe have provided a set of educational tools through the NeotomaDB GitHub repository in the Workshops repository. These are free to share, and can be modified as needed.