A data package which lists every command in base R packages since R version 1.0.1.
The latest R version covered is 4.1.3.
You can view the data online in a Shiny app.
From CRAN:
Versions 4.0.0 and up are installed from the CRAN apt repositories for Ubuntu Bionic.
Versions 3.0.1 to 3.6.3 are installed from the CRAN apt repositories for Ubuntu Trusty Tahr. Version 3.5.0 and up use a special repository.
Versions 2.5.1 to 3.0.0 are built from source on Ubuntu Lucid Lynx.
Versions 1.2.3 to 2.4.1 are mostly built from source on Debian Sarge.
Versions 1.0.1 to 1.2.2 (and a couple of later versions) are built from source on Debian Woody.
Results are found from running ls on all installed packages from a minimal installation. Recommended packages are not included.
The Rversions data frame lists versions of R and release dates.
./control build builds the images. Or get them from https://hub.docker.com/r/dash2/rcheology/../control run runs the images to build/install R and extract data./control gather gets CSV files from the containers./control write puts CSV files into a data frame and stores it in the packagelibrary(rcheology)
data("rcheology")
rcheology[rcheology$name == "kmeans" & rcheology$Rversion %in% c("1.0.1", "1.9.0", "2.1.0", "3.0.2", "3.2.0", "4.0.2"), ]
#> package name Rversion type exported class generic
#> 202746 mva kmeans 1.0.1 closure TRUE <NA> FALSE
#> 222229 stats kmeans 1.9.0 closure TRUE function FALSE
#> 222233 stats kmeans 2.1.0 closure TRUE function FALSE
#> 222272 stats kmeans 3.0.2 closure TRUE function FALSE
#> 222277 stats kmeans 3.2.0 closure TRUE function FALSE
#> 222302 stats kmeans 4.0.2 closure TRUE function FALSE
#> args
#> 202746 (x, centers, iter.max = 10)
#> 222229 (x, centers, iter.max = 10)
#> 222233 (x, centers, iter.max = 10, nstart = 1, algorithm = c("Hartigan-Wong", "Lloyd", "Forgy", "MacQueen"))
#> 222272 (x, centers, iter.max = 10, nstart = 1, algorithm = c("Hartigan-Wong", "Lloyd", "Forgy", "MacQueen"), trace = FALSE)
#> 222277 (x, centers, iter.max = 10L, nstart = 1L, algorithm = c("Hartigan-Wong", "Lloyd", "Forgy", "MacQueen"), trace = FALSE)
#> 222302 (x, centers, iter.max = 10L, nstart = 1L, algorithm = c("Hartigan-Wong", "Lloyd", "Forgy", "MacQueen"), trace = FALSE)Latest changes:
suppressPackageStartupMessages(library(dplyr))

r_penultimate <- sort(package_version(unique(rcheology::rcheology$Rversion)),
      decreasing = TRUE)
r_penultimate <- r_penultimate[2]

r_latest_obj <- rcheology %>% dplyr::filter(Rversion == r_latest)
r_penult_obj <- rcheology %>% dplyr::filter(Rversion == r_penultimate)

r_introduced <- anti_join(r_latest_obj, r_penult_obj, by = c("package", "name"))

r_introduced
#> [1] package  name     Rversion type     exported class    generic  args
#> <0 rows> (or 0-length row.names)
Base functions over time:
library(ggplot2)

rvs <- rcheology$Rversion     %>%
      unique()                %>%
      as.package_version()    %>%
      sort() %>%
      as.character()

major_rvs <- grep(".0$", rvs, value = TRUE)
major_rv_dates <- Rversions$date[Rversions$Rversion %in% major_rvs]
major_rvs <- gsub("\\.0$", "", major_rvs)

rch_dates <- rcheology %>% left_join(Rversions, by = "Rversion")
ggplot(rch_dates, aes(date, group = package, fill = package), colour = NA) +
      stat_count(geom = "area") +
      theme(axis.text.x = element_text(angle = 45, hjust = 1, size = 8)) +
      # ggthemes::scale_fill_gdocs() +
      scale_x_date(breaks  = major_rv_dates, labels = major_rvs) +
      xlab("Version") + ylab("Function count") +
      theme(legend.position = "top")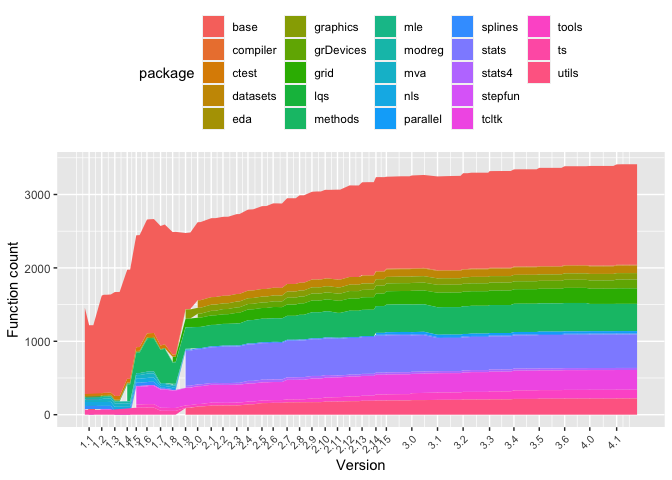
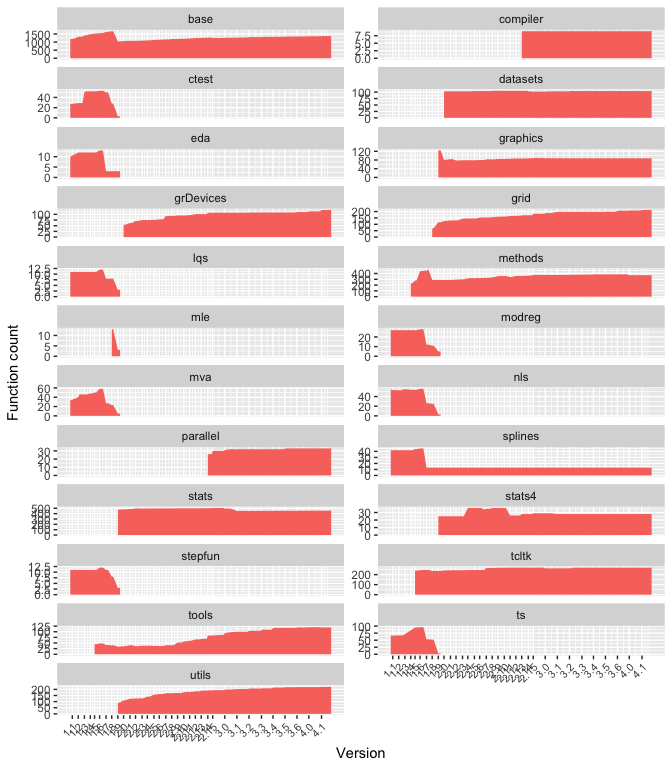
An alternative view:
ggplot(rch_dates, aes(date, fill = "orange")) +
      stat_count(geom = "area") +
      scale_x_date(breaks  = major_rv_dates, labels = major_rvs) +
      theme(axis.text.x = element_text(angle = 45, hjust = 1, size = 8)) +
      xlab("Version") + ylab("Function count") +
      facet_wrap(~package, scales = "free_y", ncol = 2) +
      theme(legend.position = "none")