![]()

![]()
![]()
The goal of stlcsb is to provide access to data from the City of St. Louis Citizens’ Service Bureau (CSB), the 3-1-1 service for the City of Saint Louis. Residents can contact the number with non-emergency service requests, and the CSB will dispatch these requests to the appropriate City agency. stlcsb also includes functions for cleaning and manipulating these data.
You should check the sf package website and the stlcsb package website for the latest details on installing dependencies for that package. Instructions vary significantly by operating system. For best results, have sf installed before you install stlcsb. Other dependencies, like dplyr, will be installed automatically with stlcsb if they are not already present.
The easiest way to get stlcsb is to install it from CRAN:
The development version of stlcsb can be accessed from GitHub with remotes:
stlcsb is used for simplified acquisition and processing of St. Louis CSB Data. In the following example, data is downloaded from the City of St. Louis, filtered to identify only calls related to waste disposal, and then projected to an sf object for mapping.
> library(stlcsb)
> library(dplyr)
>
> csb <- csb_get_data(year = 2017)
trying URL 'https://www.stlouis-mo.gov/data/upload/data-files/csb.zip'
Content type 'application/x-zip-compressed' length 60999726 bytes (58.2 MB)
==================================================
downloaded 58.2 MB

>
> csb_filter(csb, var = problemcode, category = cat_waste) %>%
+   csb_missingXY(varX = srx, varY = sry, newVar = "missing") %>%
+   filter(missing == FALSE) %>%
+   csb_projectXY(varX = srx, varY = sry) -> waste_2017
Notice that variable names can be either quoted or unquoted, since stlcsb makes full use of non-standard evaluation.
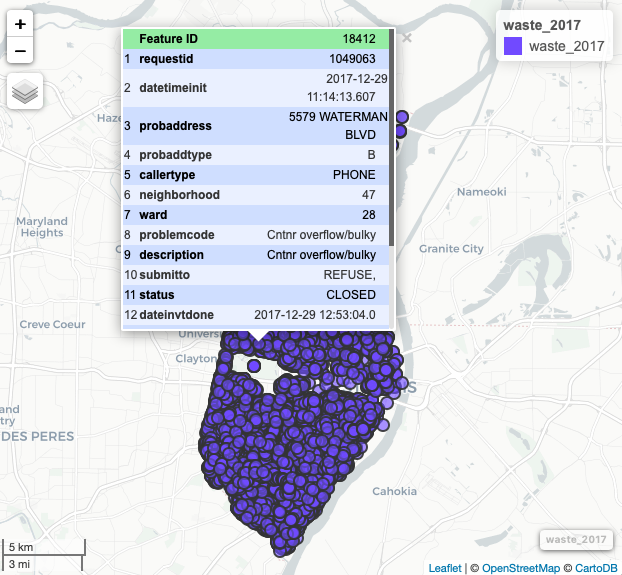
Once the data are projected, they can be explored with packages like mapview:
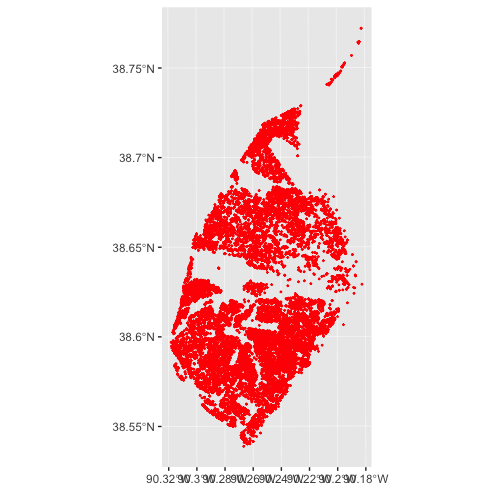
These data can also be mapped using ggplot2 once they have been projected:
Please note that this project is released with a Contributor Code of Conduct. By participating in this project you agree to abide by its terms.